Smaller is Better: Improve Mycotoxin Analysis Results by Reducing Particle Size

The latest research is showing that particle size in a sample has a considerable effect on the accuracy of mycotoxin analytical methods. Mycotoxin experts Henriette Hobbs and Nora Kogelnik size up the problem and offer a few recommendations to keep your mycotoxin testing operations accurate and reliable.
Published on:
Mycotoxin
In the mycotoxin analytical community, we generally work with three main procedural steps when it comes to agricultural commodities such as corn, wheat, and barley: sampling, sample preparation and analysis. To determine the mycotoxin concentration present in a bulk lot, we must analyze a smaller but still representative portion of the lot; this means that reliable results are impossible without a proper sampling plan, which includes taking incremental samples of the lot and combining them into a subsample (also known as a bulk sample). This forms a basis that ensures that the sample to be tested is truly representative of the lot.
From here, our focus moves to sample preparation. For grain-based products, sample preparation consists of two important steps, grinding the sample and subsampling: 1) a mill or other device is used to grind the grain in the bulk sample to reduce particle size and to ensure uniformity; 2) from this sample, we obtain a subsample representative of the whole lot, which we then test. This test sample is subsequently prepared for extraction according to a defined protocol [10].
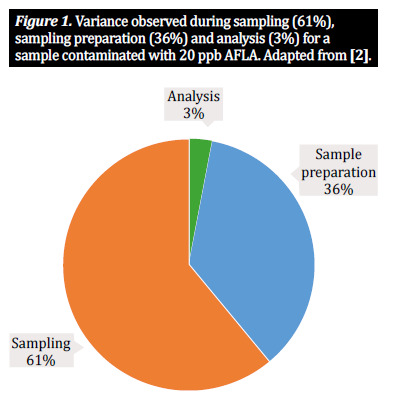
Yet sampling and sample preparation are complex- processes, rife with potential pitfalls; each step within- the sample preparation process introduces a level of variability that contributes to the total variability within a single analytical result [2, 5]. Numerous studies have shown that two thirds of the observed variability result from the method of sampling, with one third attributable to the way the sample is prepared. A much smaller percentage of variability relates to the analytical method being applied (figure 1).
Accordingly, accurate results depend on the degree to which we take these three factors into account. While numerous studies discuss the importance of sampling- methods and analytical solvents on the effect of mycotoxin detection (see [1, 2, 4] for prominent examples), this article will consider the importance of sample preparation, i.e. grinding and sample size, and, in summarizing recent research on the matter, discuss the effect sample preparation has on accurate myco-toxin analysis and sample variance [10].
Select a representative sample
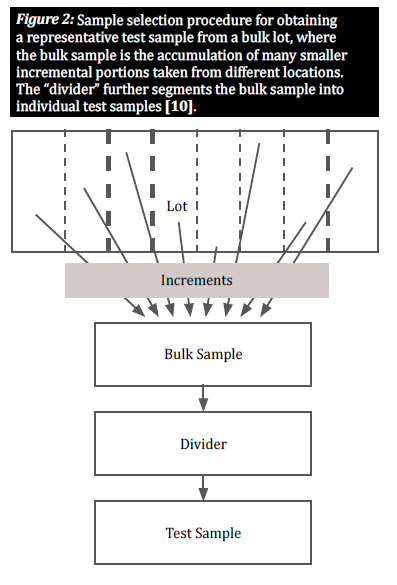
When a commodity is naturally contaminated with mycotoxins, contaminated kernels are generally distributed unequally throughout a certain lot; these groupings of contaminated kernels are known as “hot spots.” To provide an accurate view of the degree of contamination in a lot, a sampling plan must account for the random distribution of such hot spots. This is done by taking a large number of small, incremental samples from various locations distributed throughout the lot in order to obtain a representative sample (figure 2) [8]. The selection of incremental samples from a bulk lot is crucial to give all grains an equal chance of being selected, thus reducing bias [10].
Grind to ensure a uniform particle size
The molds that produce mycotoxins have several different routes of contamination; as a result, mycotoxins can be found both inside of grains and on the surface. The route of infection is dependent on the mycotoxin and the grain in question. It is well known that certain mycotoxin-producing fungi, such as Fusarium, are present within the grain or kernel while others, such as Aspergillus, are present on the surface. Grinding a sample uniformly solves this problem by breaking open contaminated kernels and allowing for an even distribution of particles. This ultimately improves the detection of contaminated particles [3].
Homogenize potential mycotoxin distribution by passing the grain through a mesh and mixing
After selecting the sample to be representative of the lot and grinding it to ensure uniform particle size, the sample needs to be homogenized by mixing it thoroughly; this also helps to make it representative of the bulk sample [3]. Grains segregate according to size, reducing the degree to which the sample is representative and leading to an inaccurate analytical result. For this reason, prior to mixing, we confirm that the uniformity of the grind is adequate by passing the ground sample through a mesh or sieve. The goal is not to filter out larger particles as they may also contain mycotoxins; on the contrary, these larger particles must be included in the sample. Rather, we ensure the uniformity of the grind by checking that a certain percentage of particles is able to pass through. The USDA-FGIS, for example, has established specifications for sample size, sample grinding, and subsampling for aflatoxin, deoxynivalenol, fumonisin, ochratoxin, and zearalenone [9]. USDA-FGIS recommends that a sample be ground such that 60-75% of the particles pass through a no. 20 sieve and that 50 g test sample (including the particles that do not pass through the sieve) be used for the extraction of the mycotoxin.
Keep your grain size small, your sample size large, and your mycotoxin results accurate
We use the terms “accuracy” and “precision” throughout this article, so a quick definition of these terms is in order here: accuracy and precision signify uncertainties associated with analysis that can be introduced from the initial sample preparation method or plan. Accuracy is defined as the closeness of a measured value to the true value, while precision is defined as the closeness of measured values to each other. The ultimate goal should be to implement a process which ensures both high accuracy and high precision [10]. Studies show that the precision of a mycotoxin detection method and hence the variance of results depend greatly on the size of the particles within the sample. To demonstrate the measurement variability associated with the size of particles within the sample and the size of the sample under analysis, we refer to several studies that evaluated it (figure 3 and figure 4). In the first study performed by Whitaker et al. (shown in figure 3), corn samples naturally contaminated by aflatoxin were characterized. The samples of differently sized grains were subsequently passed through a no. 20 sieve: 1) a coarse grind (60% of the particles passed through), 2) a fine grind (99% of the particles passed through) and 3) powdered (with a hammer mill). Eight samples from each grinding interval were then analyzed using a modified HPLC reference method to demonstrate inter-sample variance within a single ground state [9].
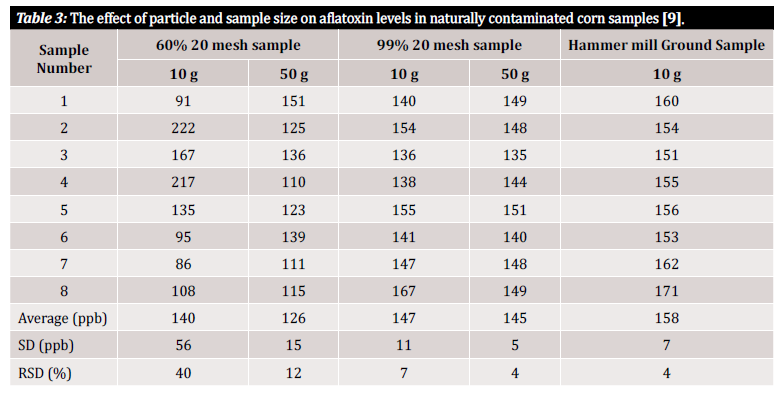
As you can see in table 3, there is variation in analytical results depending on both sample size and grind size. Yet how can we quantify this variation in a way that is useful to us? The relative standard deviation (RSD) or coefficient of variation (CV) are often used to determine how dissimilar results in a particular data set are. The RSD is often declared as a percentage and is defined by the ratio of the standard deviation to the mean. The lower the standard deviation, the less variation within the data set and the more reliable the result. In the data from the study depicted in table 3, significant variability was observed between samples of 10 g consisting of different particle sizes. The 10 g of coarsely ground samples show at 40% the highest RSD when compared to the more finely ground sample (99% 20-mesh sample), with a calculated RSD of 7%. The lowest RSD, 4%, was be reached with powdered samples from the hammer mill. Although a hammer mill may not typi-cally be financially feasible for the average tester, the study by Whitaker et al. demonstrates that the best way to avoid variance coming from sample preparation is to grind finely and to use a mesh to ensure the uniformity of particle size [9].
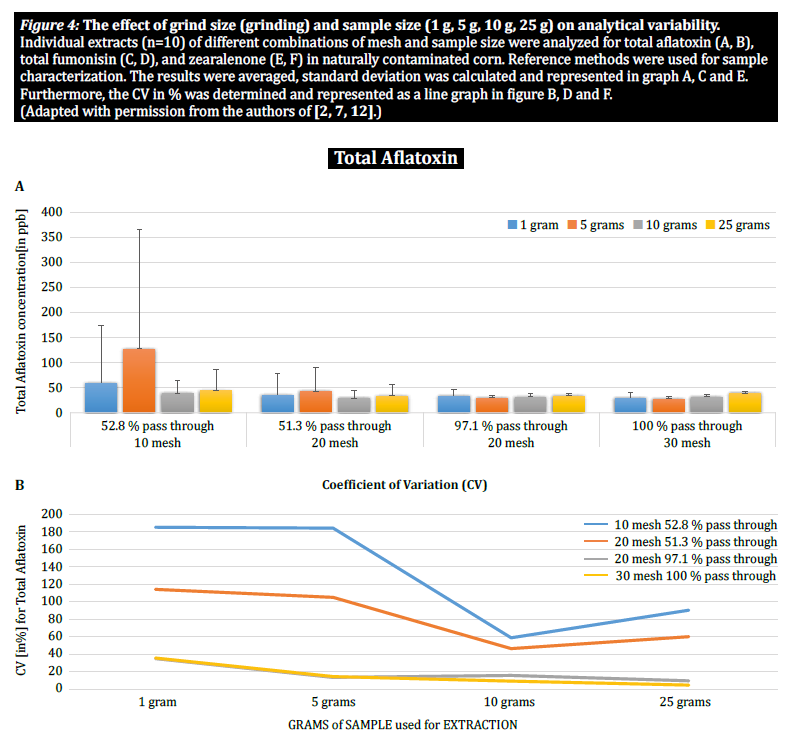
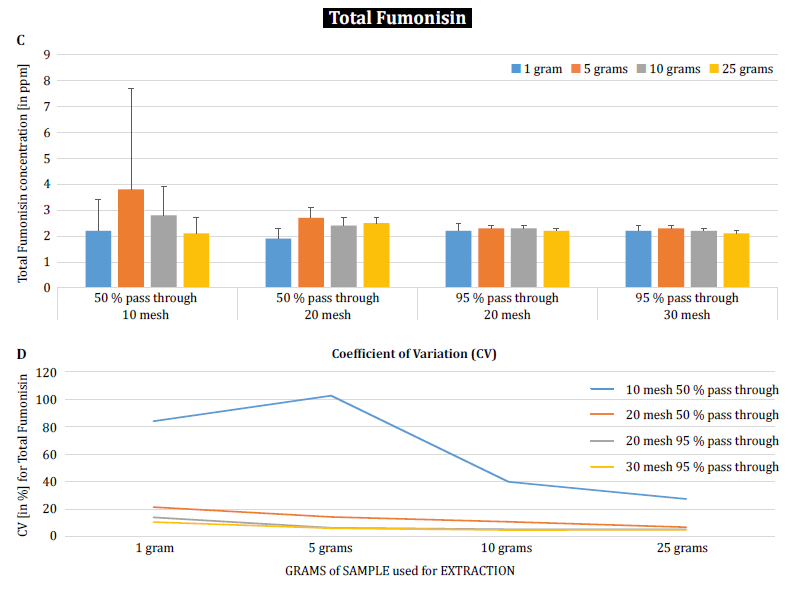
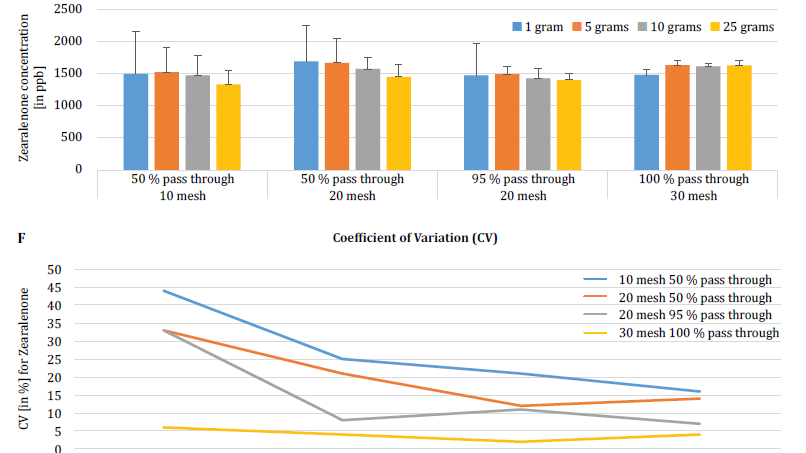
To further demonstrate the impact of particle size (grinding) and sample size on analytical variability among different mycotoxins, Brunkhorst et al. performed an analysis on corn samples naturally contaminated with either total aflatoxin (sum of B1, B2, G1 and G2), total fumonisin (sum of B1, B2 and B3) or zearelenone (figure 4). For this study, 10 corn samples for each mycotoxin were ground to different particle sizes to allow them to pass through either a no. 10 sieve, a no. 20 sieve or a no. 30 sieve. The variance of different sample sizes (1 g, 5 g, 10 g and 25 g) for extraction were also further investigated. The aflatoxin samples were extracted with acetonitrile/water (84/16) and analyzed using an AOAC method and a KOBRA cell for post column bromination. Fumonisin samples were extracted with methanol/water (3/1) and also analyzed according to the method of AOAC. Zearealenone samples were also extracted with acetonitrile/water and analyzed using LC-MS/MS.
Note: The data shown in each pair of graphs is somewhat redundant. However, we find it useful to represent the coefficient of variation in a separate graph.
The results clearly show that the grind size and sample size impact the accuracy of the analysis. The study suggests that AFLA and ZON exhibit a higher degree of dependency (i.e. a higher CV) on sample volume and grind size than FUM, though we hesitate to draw a firm conclusion from these individual studies; more research is needed to confirm our observation. For sample sizes of 1 g and 5 g, the RSDs for AFLA, FUM, and ZON were higher compared to sample sizes of 10 g and 25 g. The variability observed for a 10 g sample of corn contaminated with AFLA declined from 58.9% (coarsely ground) to 9.3% (finely ground), for FUM from 39.8% (coarsely ground) to 4.6% (finely ground), and for ZON from 21% (coarsely ground) to 2% (finely ground). These results further affirm the effect of grind size on analytical variance and accuracy with regards to mycotoxin extraction and analysis from grains.
Finally, Brunkhorst et al. further elucidated their findings and determined deoxynivalenol levels in naturally contaminated barley samples with the same study outline. Barley samples were ground to four different mesh sizes, extracted (10 individual extracts at each mesh and sample size) using acetonitrile/water (84/16) and analyzed by LC-MS-MS (figure 5) [6].
The results clearly demonstrate that the analytical variability can be reduced when samples are ground to pass through a finer mesh size. Furthermore, increasing the sample size further helps to reduce the analytical variability. The coefficient of variation was able to be reduced from 11% to just 5% when using a 10 g sample with a no. 10 mesh. A sample size of 10 g and 25 g in combination with a no. 20 mesh (95%) and no. 30 mesh (95%) provides accurate and precise results, reducing the CV to 5% and 3%, respectively. As this study used barley instead of corn, it suggests that the effect of the sample size and grinding on the analytical variability of mycotoxins may not be matrix-dependent. Further study is necessary to confirm this [6].
Conclusion: Mesh, mix, repeat as needed
The importance of sample grinding and sample size, as well as the impact these factors have on reducing variability and minimizing errors during mycotoxin analysis, is evident. In the studies presented, significant variation was observed between coarsely and finely ground samples from the same source and contamination level.
Beyond simple observation of variation, the data from these studies suggest some initial approaches to sample size and grinding. As for sample size, 10 g has proven to be sufficient, while 25 g may provide even greater accuracy. When using a no. 20 mesh, 95% of the sample should pass through. When using a no. 30 mesh, 100% should pass through.
The main goal of mycotoxin analysis is to obtain accurate and reliable results despite the difficulties of sampling and the complexities of sample preparation for grain and crops. Yet even the best technology, whether it be in the form of cutting-edge rapid tests or highly precise mass spectrometry equipment, will be of no avail if your sample isn’t representative of the lot under examination. There’s more to a representative sample than just the sampling; sample preparation is key. If you adhere to the three key factors of sample preparation (grind size, sample size and homogeneity), you can keep your RSD at <10%, increasing the trustworthiness of your analytical result.